This script was created to visualise and compare data from different segments recorded via the Xsens MVN system. Therefore several diagrams issued showing the development of acceleration, velocity and positions (regarding a global center) of different segments during the running time of the record. The diagrams are either showing the development of single components (X, Y, Z) of the plotted variables, or the calculated absolute vectors of these components. Some example outputs are shown below.
plotMVNXData
Usage and argument information for R/plotMVNXData:
Usage: R/plotMVNXData
	[-[-help|h]]
	[-[-verbose|v]]
	[-[-inputfile|i] :character:]
	[-[-outputdir|o] :character:]
	[-[-segments|s] :character:]
	[-[-min|a] [:integer:]]
	[-[-max|b] [:integer:]]
	[-[-colors|c] [:character:]]
	[-[-format|f] [:character:]]
	[-[-title|t] [:character:]]

Arguments without parameters:
  --help: show this information
  --verbose: activating informational output while parsing

Required arguments:
  --inputfile: mvnx file with 3D motion data
  --outputdir: directory to save images
  --segments: comma separated list of segment names to plot

Optional arguments:
  --colors: comma separated list of colors for each segment
  --format: format for output, one of bmp, jpg, pdf [default], png, ps, wmf
  --min: plot a section beginning at that time [in ms]
  --max: plot a section ending at that time [in ms]
  --title: one title for all the diagrams
Example output of R/plotMVNXData:
The global coordinate system achses are defined as follows:
- X: pointing to the local magnetic north
- Y: according to the right hand coordinates (pointing the west)
- Z: pointing up
Comparison of Two Segments
The segments LeftFoot and RightFoot during several steps of a natural walk are shown in the gallery below.
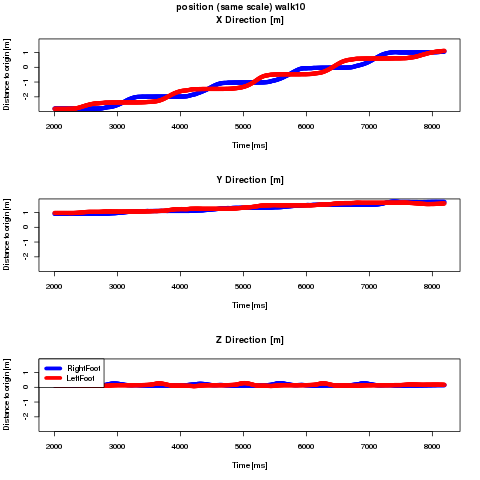
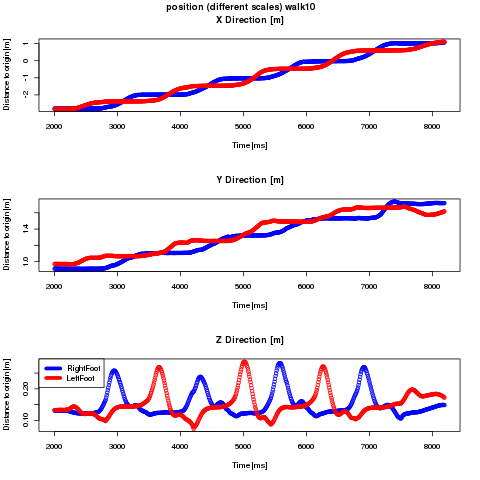
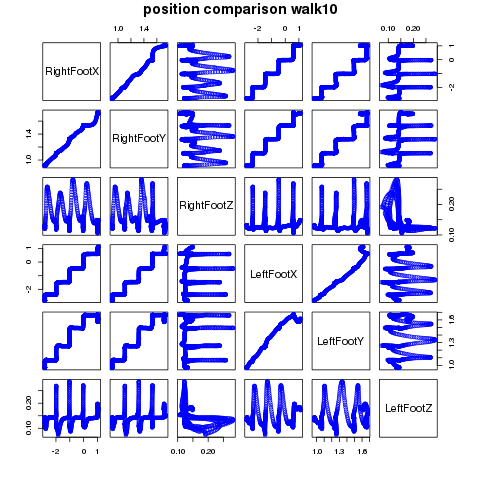
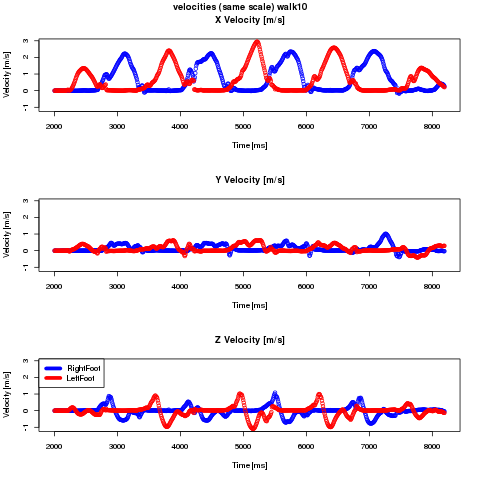

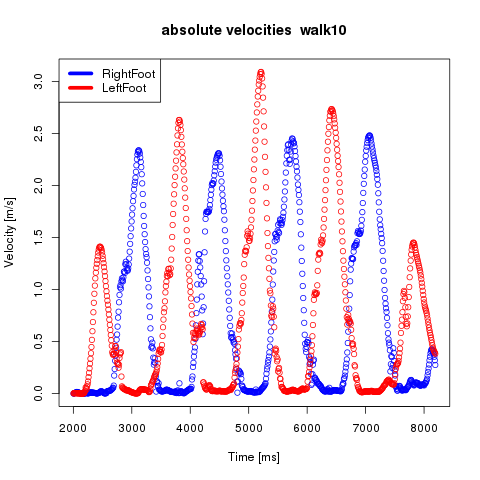
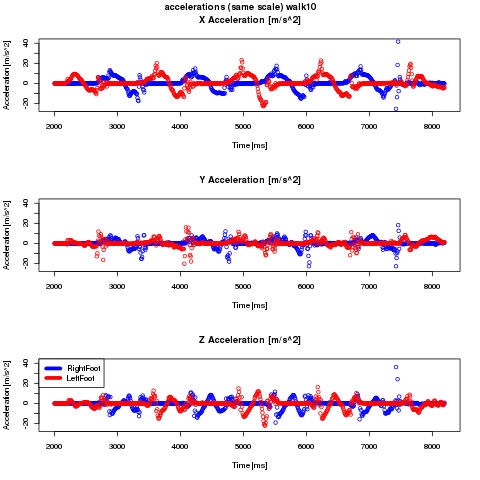
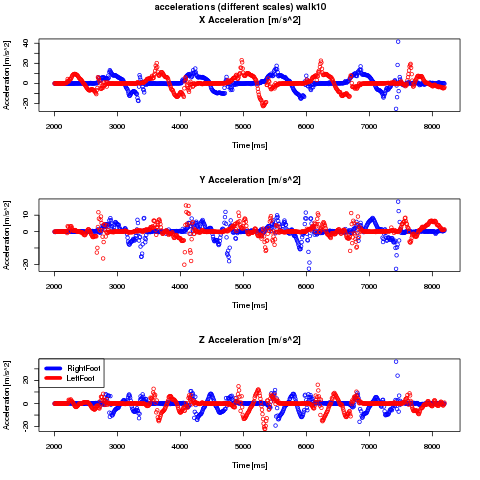
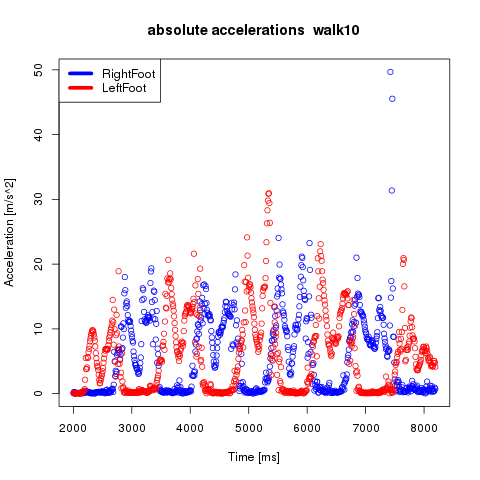
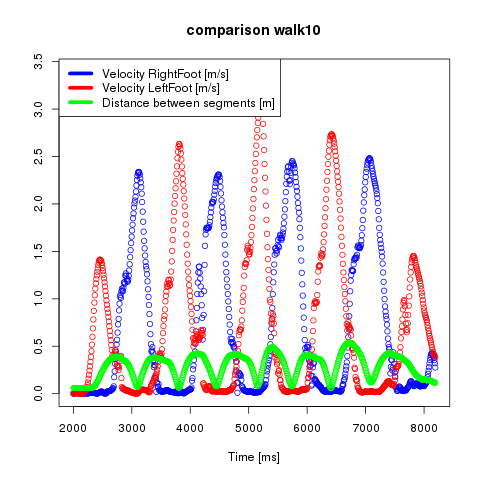
Original call: ./calcStepLength --inputfile="../experiments/experiment1/walk10.mvnx" --outputdir="online/images/diagrams/walk10/" --segments="LeftFoot, RightFoot" --format="png" --title="walk10" --min="2000" --max="8200" --colors="blue, red, green, cyan, orange, darkblue, darkred"
Comparison of Three Segments
The segments LeftFoot, RightFoot and Pelvis during several steps of a natural walk are shown in the gallery below.
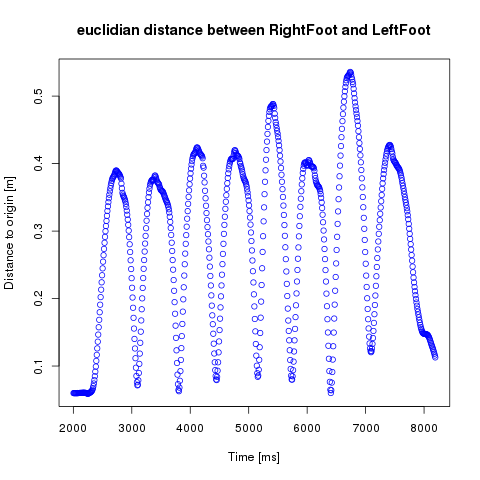
Please note that the comparison diagram for the absolute velocities with the euclidian distance between two segments only is available when two segments are compared.
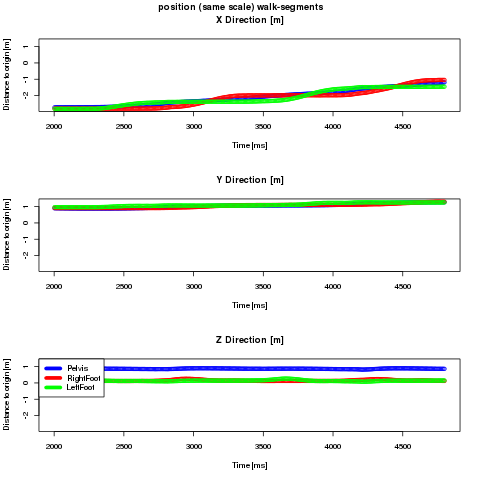
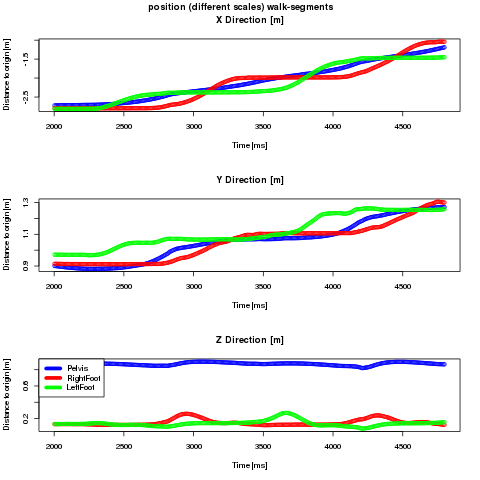
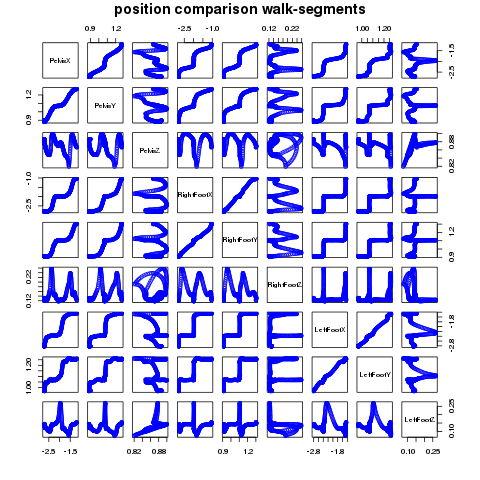
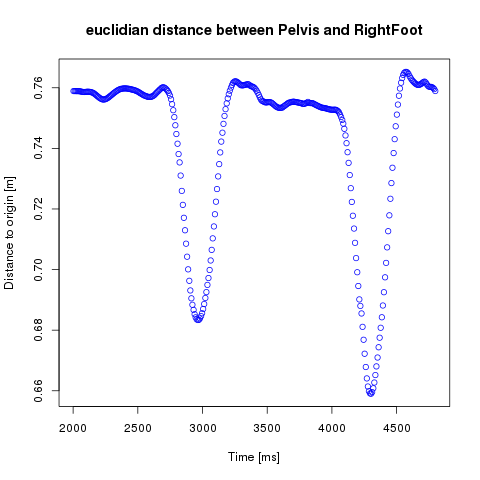

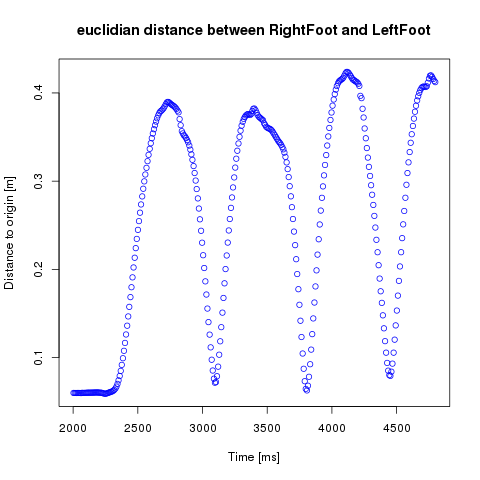
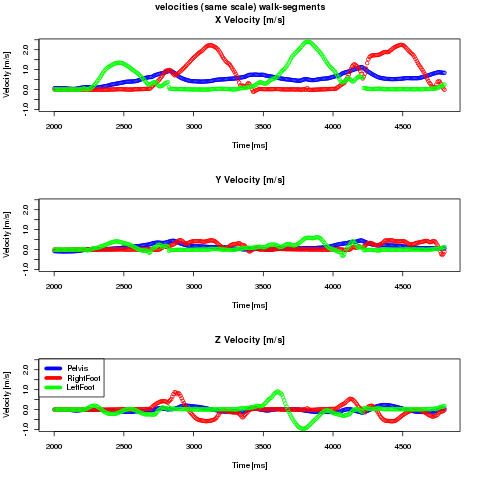


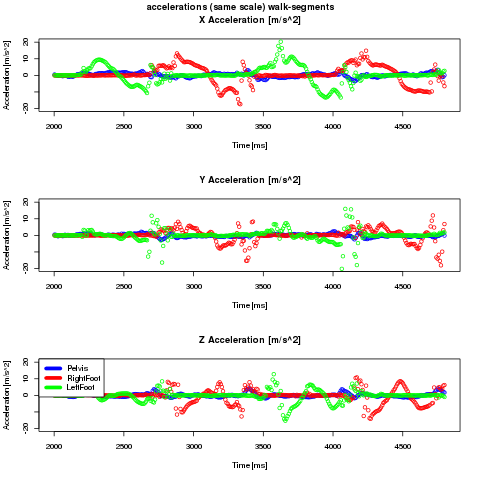
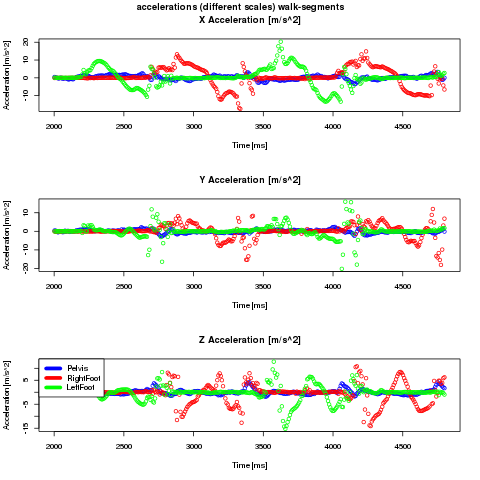
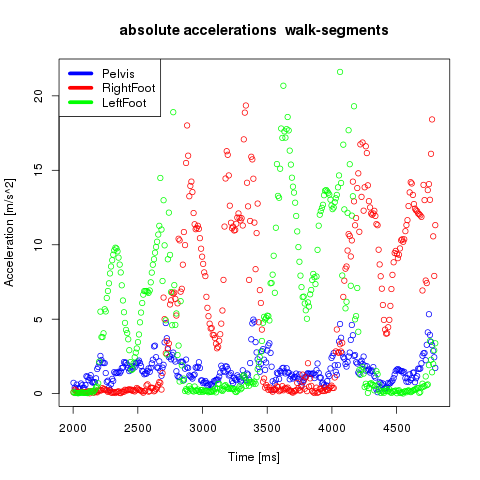
Original call: ./calcStepLength --inputfile="../experiments/experiment1/walk10.mvnx" --outputdir="online/images/diagrams/walk-segments/" --segments="LeftFoot, RightFoot, Pelvis" --format="png" --title="walk-segments" --min="2000" --max="4800" --colors="blue, red, green, cyan, orange, darkblue, darkred"