Introduction
The General Transit Feed Specification (GTFS) is a group of files that defines a common format for public transportation schedules and other geographic information. GTFS allows public agencies to publish their data to be used in the feed. The goal of the project was to build a tool (GTFS mapper) that given a GTFS feed would generate an alternative feed with the same formate and describing the same region, but using open source data. This is due to the fact that the data uploaded from the public agencies is not always sufficient.
Open Street Map (OSM) is an open source project that shows the maps of the world. It is built by volunteering users from all over the world. GTFS mapper is a tool given a GTFS feed for a certain city and the osm data representing the same city would output a new feed with the same format of GTFS, but is produced using information and coordinates from the OSM data.
Dependencies
The project utilizes two main libraries in the implementation. First, the libosmium library which is used in parsing the xml file. Second, the C++ boost libraries which handles building the graph and retrieving paths from it.
Libosmium
- Install first the libary dependencies.
- Download and build the library from source.
- Follow the build instructions on the same github page. We recommend installing the library locally.
Boost libraries
- Install boost library directly.
- Boost version used within the project is 1.58. Other versions should work properly as well.
Usage
- Create a build folder inside the project and build the project as follows:
- Run with the osm xml file to build the graph first
- Generate new GTFS format feed
- To generate this help message, use ./gtfsmapper --help.
    $mkdir build
    $cd build
    $cmake ..
    $make
    Usage: ./gtfsmapper buildgraph <osm_feed.osm> -o [<graph repository>]
    buildgraph [mandatory]:               output graph files mode
    <osm_feed.osm> [mandatory]:           path to osm data directory
    -o [<graph repository>] [optional]:   specify directory to save graph files to, if not specified graph/ is used
    /gtfsmapper shapes  [-g <graph repository>] [-o <gtfs output>] -e
    shapes [mandatory]:                   generate new GTFS format shapes from osm data
    [-g <graph repository>] [mandatory]:  path to graph files generated in buildgraph mode
    [-o <gtfs output>] [optional]:        specify directory to save new feed
    -e [optional]:                        generate evaluation console report in runtime
Implementation
The full functionality of GTFS mapper can only be reached by running the tool with two different modes:
Read mode
The purpose of this mode is to read the .osm file and extract from it the data that would be used to build a graph that represents the map. To use this mode the .osm file and the keyword buildgraph should be passed to the program like in the following command $./gtfsmapper buildgraph theOsmFile.osm .
The OSM format has three types of objects:
- Node: A node is point on the map that has an Id, latitude and longtitude. A node could be a stop or just a point on the map.
- Way: A way is a list of nodes that if connected will show a path.
- Relation: A relation is list of nodes and ways that a have relation in common. In this project we are only interested in relations of type route, all members of such a relation are part of a public transportation route.
Step 1
An instance of the object relCollector is created (a sub class of libosmium's collector that we implmented), this class allows us to iterate on the relations in the osm file. The implementation of this class can be found in osmParser files.
    class relCollector : public osmium::relations::Collector
      {
     public:
        // Function responsible to keep the relations required through
        // checking the tags of the relations. Kept relations are rail routes.
        bool keep_relation(const osmium::Relation& r);

        // Callack function called automatically once all the nodes/ways in
        // the relations filtered in keep_relation(const osmium::Relation& r)
        // are found in the osm xml file. The function process the relation
        // nodes and ways saving them into maps.
        void complete_relation(osmium::relations::RelationMeta& relation_meta);
    };
Step 2
Next a libosmium reader is created with the input file and then passed to the collector. The collector will then automaticly read the input file and extract the data needed by calling the method complete_relation on each complete relation found while reading the input file. In this method all the ways found in a relation will be stored in the map wayToNodes where the key is the Id of the way and the value is a list of the Ids of the nodes in this way. Also the nodes will be stored in the maps pathNodes and StopNodes where the key is the node Id and the value is the corresponding libosmium node object. pathNodes has all the nodes found in the relations, while stopNodes has only the nodes that are stops. An extra reader reader3 is used to gather more information about the nodes already saved.
    // Creating 3 file readers for the osm input map
    osmium::io::Reader reader{input_file};
    osmium::io::Reader reader2{input_file};
    osmium::io::Reader reader3{input_file};

    osmium::relations::Collector
     collector;

    std::cout << "Parsing " << argv[2] << " ... " << std::endl;
    // First Reader is passed to the collector to select the relations
    // we are interesed in.
    collector.read_relations(reader);

    // Second reader is to read the members (nodes and ways)
    //  of the relations selected from the collector.
    osmium::apply(reader2, collector.handler());

    // Third reader is used to read the nodes in the member ways
    // of the relations selected from the collector.
    WayNodesDataHandler handler;
Step 3
Finally the global maps are saved to binary files to be used in the generate mode.
    // Writing the maps pathNodes, stopNodes and wayToNodes
    // to binary files for usage in the Generate mode.
    std::ofstream ofsPath(graphFilesDir+"/pathNodes");
    {
        boost::archive::text_oarchive oap(ofsPath);
        oap << pathNodes;
    }
    std::ofstream ofsStop(graphFilesDir + "/stopNodes");
    {
        boost::archive::text_oarchive oas(ofsStop);
        oas << stopNodes;
    }
    std::ofstream ofsWay(graphFilesDir + "/wayToNodes");
    {
        boost::archive::text_oarchive oaw(ofsWay);
        oaw << wayToNodes;
    }
Generate mode
The purpose of this mode is to use a GTFS feed and the data saved from the read mode to generate a new transit feed representing the same region in the input GTFS feed. This mode could be divided into the following steps:
Step 1
The input GTFS is first passed to a paser that reads and creates data structures that describe the data of interest from the feed. These data structues will be used in the following steps.
    gtfsparser::Parser parser;
    gtfsparser::gtfs::Feed feed;
    try {
        std::cout << "Parsing " << argv[2] << " ... " << std::endl;
        parser.parse(&feed, argv[2]);
        std::cout << "Done, read " << feed.getAgencies().size()
            << " agencies, " << feed.getStops().size() << " stops, "
            << feed.getRoutes().size()
            << " routes, " << feed.getTrips().size() << " trips, "
            << feed.getShapes().size() << " shapes, "
            << feed.getServices().size()
            << " services." << std::endl;
    }
Step 2
Next we load the data saved from the read mode.
    {
        std::ifstream ifs(graphFilesDir + "/pathNodes");
        boost::archive::text_iarchive iap(ifs);
        iap >> pathNodes;
    }

    {
        std::ifstream ifs(graphFilesDir + "/stopNodes");
        boost::archive::text_iarchive ias(ifs);
        ias >> stopNodes;
    }

    {
        std::ifstream ifs(graphFilesDir + "/wayToNodes");
        boost::archive::text_iarchive iaw(ifs);
        iaw >> wayToNodes;
    }
Step 3
In this step we will build a graph that will be used to find the shortest path between transportation stops. For the graph implementation we used Boost Graph Library (BGL). To build the graph we iterate on the map of ways saved from the read mode. For each node found in a way a node is added to graph and for each two consecutive nodes in a way an edge is added between these two nodes and the weight of the edge is the pyhsical distance between the two nodes. This method could be found in the class osmCustomGraph.
Step 4
This is the last step in the generate mode where we create a new shapes.txt file. Shapes.txt is a file in GTFS that describes some shapes of interest, where a shape is a list of coordinates that describe a certain path. We start by looking back at the input GTFS, specifically the trips. In GTFS each trip corresponds to a shape i.e. they both describe the same path, however a trip is only a list of the transportation stops that the path goes through, on the other hand shapes are not only described by the stops it goes through, but also other points on the map that is to describe the shape more accuratly. So we iterate on the trips from the GTFS feed and for each trip we go through the transportation stops it has. For each two consecutive stops in a trip we will run an A* search on our graph between these two stops. The paths returned from these searches are appended together to form a shape that is then added to our new shapes.txt file.
Evaluation Metrics
A proper evaluation can be stated simply as “how much the generated feed shape is similar to that of the GTFS shape”. Though it can be easily put into words. Yet, this is not a trivial problem. The first proposal was to compute the areas enclosed between the two shapes. However, the discrete computation of long paths would be computationally expensive. In addition, boost geometry libraries does not support self intersecting polygons which happens in our case. The second proposal and the implemented one is a combination between two metrics that describes the shapes more thoroughly. The metrics are:
- Compute the percentage error in the difference in length between the two shapes.
- Compute the distance between all the nodes in the generated feed shape with the nearest equivalent point in the actual feed shape. The individual deviation distances are summed and averaged by the number of nodes in the shape resulting in the average deviation for the shape.
Combining both metrics give an indication on how similar the shapes are through computing the percentage error in the path distance in addition to the average path deviation across the two shapes.
Evaluation example for one shape: > Trip #1306.T0.11-1-I-j17-1.2.H added a new shape (id = 11-1-I-j17-1.2.H) with length = 9.547km and 434 anchor points. > Shape length error is 0.3587% with average path deviation of 13.45m.
Results and Evaluation
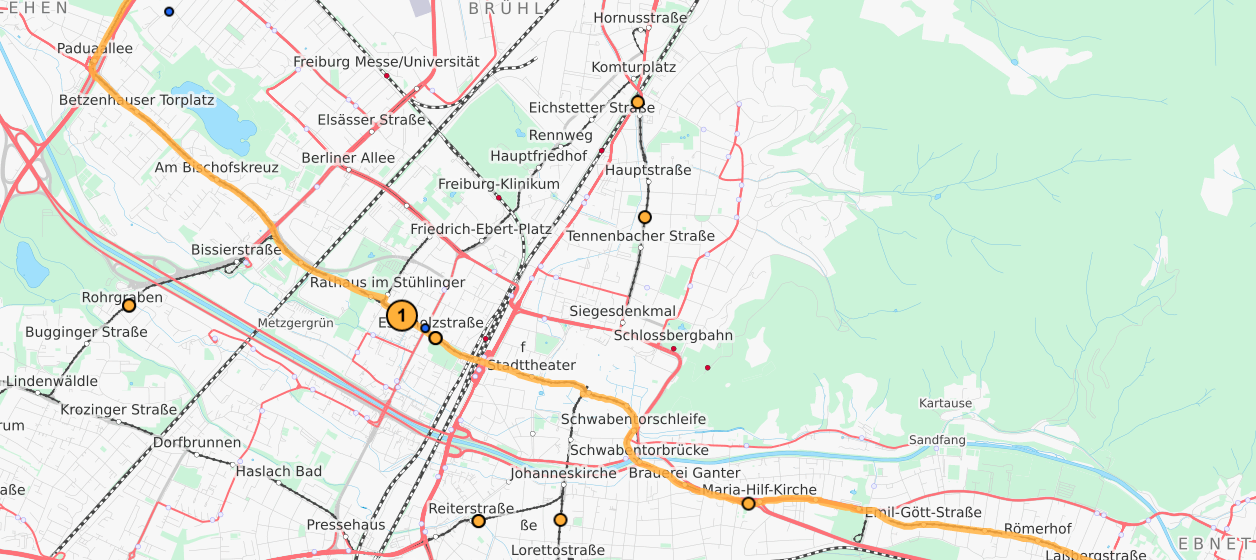
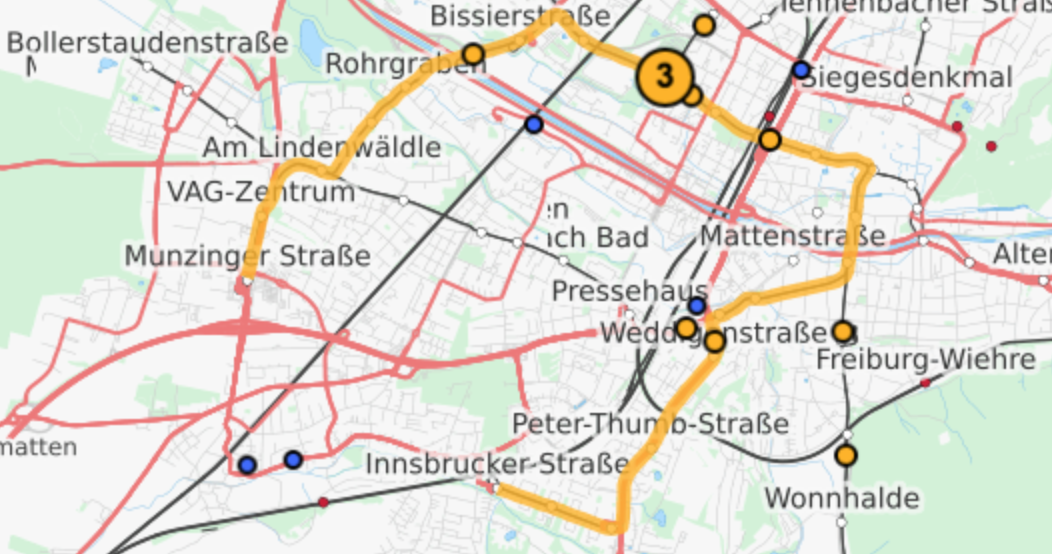
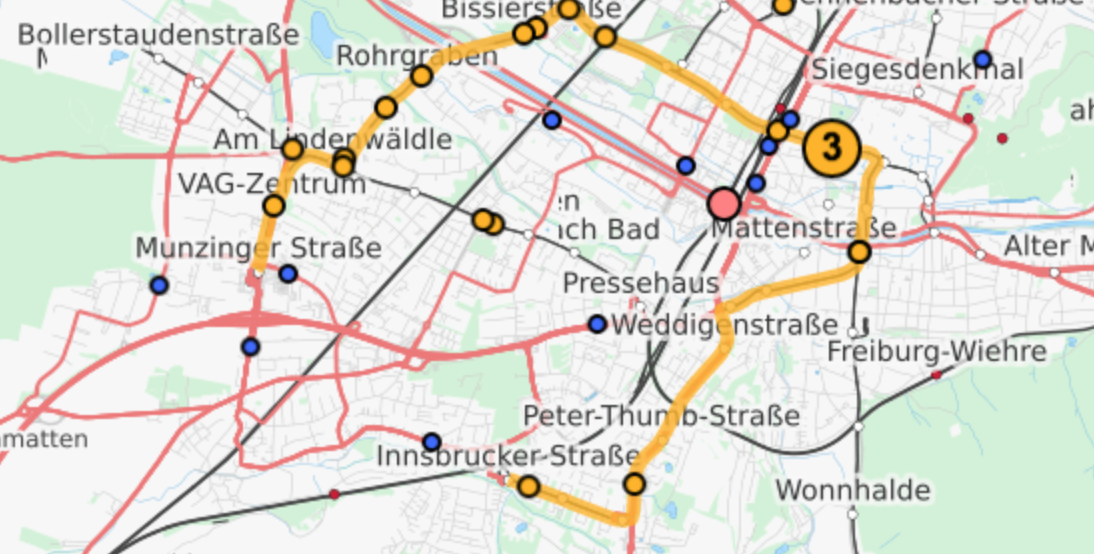
The rail map of the city of Freiburg in Germany is used for testing the implemented concept. It is important to point that the sole type of rail available in Freiburg is the Tram. However, the software handles maps with multiple types of rail as well. The metrics used for evaluation are the ones introduced in the previous section. Results show that our approach is quite relevant to the GTFS feed. The GTFS mapper implemented replaced and added 82 shapes. For the replaced shapes, average path deviation was 14.22m, best percentage error distance of 0.1147%, best deviation error of 3.275m, worst percentage error distance of 25.92% and worst deviation error of 37.14m. For results visualization, the generated shapes were integrated in Travic software. Travic is a tracker that provides movement visualization of transit data published by transit agencies and operators from all over the world. Visualization for one route (tram line number 3 in Freiburg) can be depicted below in figures below. Figure 2 shows the route defined by the shapes generated from the GTFS mapper implemented. Figure 3 shows is the route defined by the actual GTFS shapes provided as reference for testing. Depicted figures show that the results are quite similar with respect to route length and route deviation.
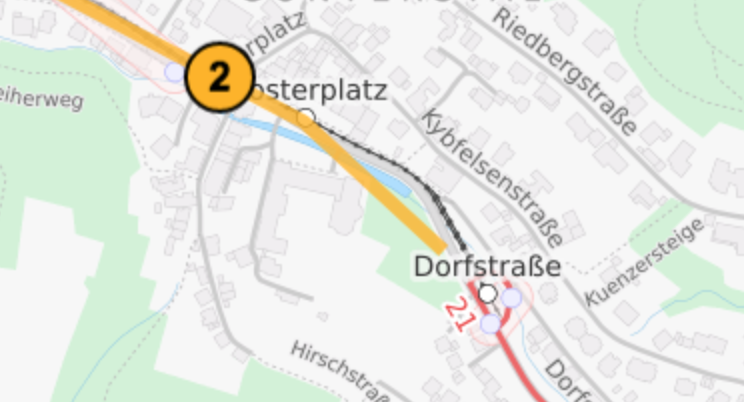
In some rare connections between two consecutive tram stops only osm way data were provided in one direction between the two stops. As a result, the a-star search fails to find a proper route on the generated directed graph due to a missing connection. In such cases, a straight line is set between the consecutive stops. Figure 4 below exemplifies the case where the osm data between the last two stations on the route are not properly sorted in the way representing the path between them. Thereby, instead a straight line replaces the actual route.
A demo for the city of freiburg can be found below
Future Work
There are several future work aspects that are worth mentioning. First, checking the performance of the GTFS mapper on the buses route is an interesting problem to explore. Second, fixing the limitation explained in the results where osm path data is misaligned. Last, perhaps further usage of osm data that might help in improving the results.
Contact us
Institute
    University of Freiburg
    Department of Computer Science
    Chair of Algorithms and Data Structures
Supervision
    Patrick Brosi
    brosi@informatik.uni-freiburg.de
Team
    Omar Kassem
    omar.kassem67@gmail.com

    Mohamed Abouhussein
    abouhussein.mohamed@gmail.com